Visualization of the Speed Range

Contents
Process:
•Visualization of the Speeds in the ETCS Speed Range
Requirements:
•Automatic Creation of ETCS Track Edges
Description:
In the ETCS overview plan, the speed range of the continuous main tracks can be displayed. The speed range of each continuous main track indicates the highest signalling speed for each direction, considering the VzG (Records of locally permitted speeds).
Procedure:
1.Start the Function 'Ranges Editor'.
Command Line: PRS_BAENDER
Ribbon: ProSig EPU -> Equipment ETCS -> Ranges Editor
2.Select the tab 'ETCS Speed Range'.
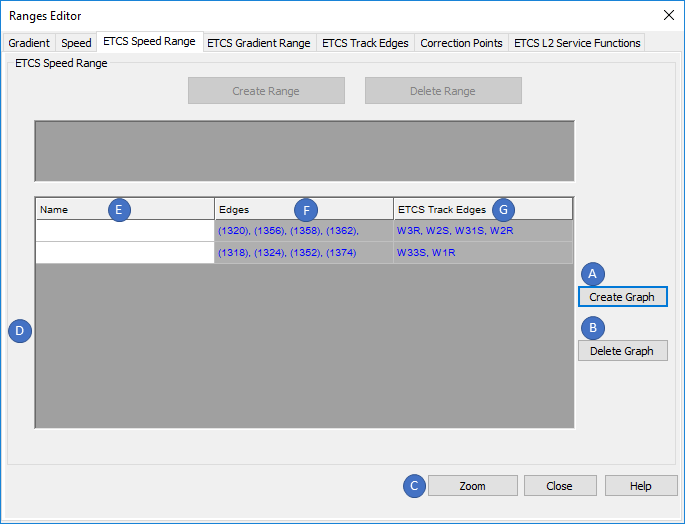
Illus.: Ranges Editor - Tab 'ETCS Speed Range'
3.In order to display an ETCS Speed Range in the ETCS overview plan, it is necessary to create first at least one ETCS Speed range graph. The ETCS Speed range graph collects all ETCS Track edges included in it and provides the data basis for the speed range.
With the button 'Create Graph' (A) it is possible to select the points on the topology along which an ETCS Speed range graph should extend.
oThe selected points should result in a mobile route. A separate ETCS Speed range graph has to be created for each mobile route, see also Step 4.
oAfter confirming the selection with the Enter key, the ETCS Speed range graph created is displayed in the List (D) with its attributes 'Edges' (F) and 'ETCS Track Edges' (G).
oThe Attribute 'Name' (E) of an ETCS Speed range graph is user-defined.
oThe ETCS Speed range graph is stored as PSO Area Object on the Layer PRS-ETCS SPEED RANGE GRAPH.
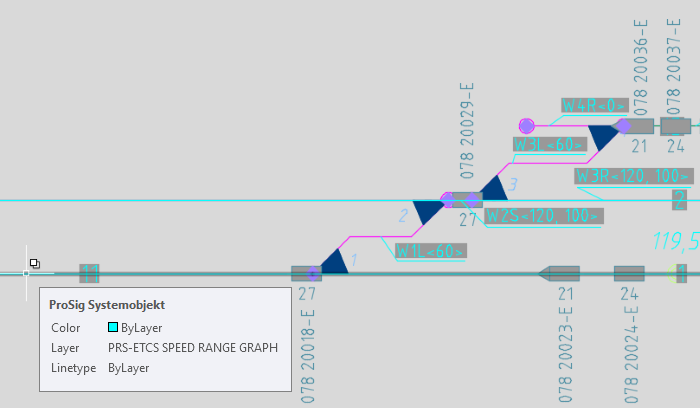
Illus.: An ETCS Speed Range Graph in the drawing
4.Step 3 is repeated until ETCS Speed range graphs are created for all mobile routes to be displayed in the Speed Range.
5.After marking an ETCS Speed range graph in the List (D), it can be deleted with the button 'Delete Graph' (B).
6.After marking an ETCS Speed range graph in the List (D), it can be zoomed with the button 'Zoom' (C) in the drawing.
7.With the function 'Create Speed Range' the ETCS Speed range can be created in the drawing.
Command Line: PRS_GESCHWINDIGKEITSBAND_ERZEUGEN
Ribbon: ProSig EPU -> Equipment ETCS -> ETCS Speed Range -> Create Speed Range
1.Enter the minimum speed limit in km/h. Enter an integer value and confirm with the Enter key.
2.Enter the maximum speed limit in km/h. Enter an integer value and confirm with the Enter key.
3.Enter the interval Size in km/h. Enter an integer value and confirm with the Enter key.
4.Select the insertion point by clicking in the drawing. The grid of the ETCS Speed range is displayed at the cross-hairs.
5.Determine the width. The width of the ETCS Speed range is determined by dragging the mouse pointer to the right and then clicking in the drawing.
oThe ETCS Speed Range is stored on the Layer PRS-ETCS SPEED RANGE.
oAny number of ETCS Speed ranges can be inserted in the drawing.
8.With the function 'Transfer Speed Range graph' an ETCS Speed range graph can be transferred to the ETCS Speed range.
Command Line: PRS_GESCHWINDIGKEITSGRAPH_UEBERTRAGEN
Ribbon: ProSig EPU -> Equipment ETCS -> ETCS Speed Range -> Transfer Speed Range graph
1.Select the Speed range to which the ETCS Speed range graph will be transferred.
2.Select the Speed graph from Step 3 which should be transferred to the ETCS Speed range.
oThe ETCS Speed range graph is visualized in the ETCS Speed range.
oThe Assigning the ETCS Range displayed in the signalling layout plan is plotted thicker in the speed range according to Ril 819.1344, see also ProSig System Objects - PSO Layer. In order to visualize in the drawing the actual line width used for the ETCS Range, set the AutoCAD system variable LWDISPLAY = ON.
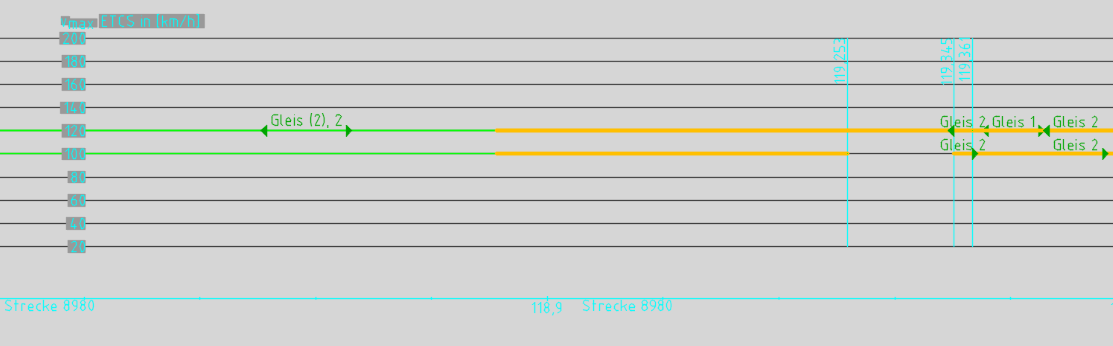
Illus.: Representation of the ETCS Speed Range in the drawing
9.The ETCS Speed range can be adjusted if necessary.
oBy marking the ETCS Speed range and then by right clicking, an additional speed range for the ETCS Speed range can be inserted via the context menu item 'Add speed scale'.
oBy selecting a displayed ETCS Speed range graph and then by right-clicking, an additional label for the displayed ETCS Speed range graph can be inserted via the context menu item 'Insert Label'.
oThe texts displayed in the ETCS Speed range can be moved after marking via Grips, see also ProSig System Objects - Move / Rotate.
10. The ETCS Speed range can be deleted with the AutoCAD function 'Erase'.