Visualization of the Gradient Range

Contents
Process:
•Visualization of Gradients in the ETCS Gradient Range
Requirements:
•Deriving the ETCS Overview Plan
•Creation of Gradient Data in Signalling Layout Plan
Description:
In the ETCS overview plan, the Ranges Editor can be used to create ETCS conformal gradient ranges from the gradient data. The creation of the ETCS Gradient ranges corresponds to the specifications in Ril 819.1344.
Procedure:
1.Start the Function 'Ranges Editor'.
Command Line: PRS_BAENDER
Ribbon: ProSig EPU -> Equipment ETCS -> Ranges Editor
2.Select the tab 'ETCS Gradient Range'.
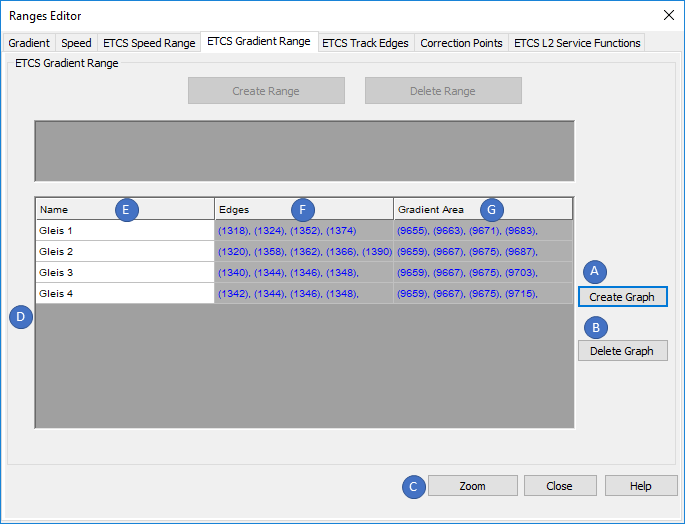
Illus.: Ranges Editor - Tab 'ETCS Gradient Range'
3.In order to display an ETCS Gradient range in the ETCS Overview plan, it is necessary to create first at least one ETCS Gradient range graph. The ETCS Gradient range graph collects all gradient areas that are included in it and provides the data basis for the gradient range. It is important to ensure that there are no gaps in the gradient areas to be displayed.
With the button 'Create Graph' (A) it is possible to select the points on the topology along which an ETCS Gradient range graph should extend.
oThe selected points should result in a mobile route. A separate ETCS Gradient range graph has to be created for each mobile route, see also Step 4.
oAfter confirming the selection with the Enter key, the ETCS Gradient range graph created is displayed in the List (D) with its attributes 'Edges' (F) and 'Gradient Area' (H).
oThe Attribute 'Name' (E) of an ETCS Gradient range graph is user-defined.
oThe ETCS Gradient range graph is stored as PSO Area Object on the Layer PRS-ETCS GRADIENT RANGE GRAPH.
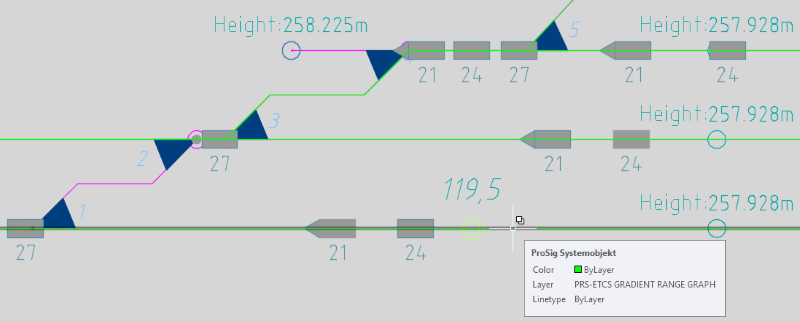
Illus.: An ETCS Gradient Range Graph in the drawing
4.Step 3 is repeated until ETCS Gradient range graphs are created for all mobile routes to be displayed in the gradient range.
5.After marking an ETCS Gradient range graph in the List (D), it can be deleted with the button 'Delete Graph' (B).
6.After marking an ETCS Gradient range graph in the List (D), it can be zoomed with the button 'Zoom' (C) in the drawing.
7.With the function 'Create Gradient Range' the ETCS Gradient range can be created in the drawing.
Command Line: PRS_NEIGUNGSBAND_ERZEUGEN
Ribbon: ProSig EPU -> Equipment ETCS -> ETCS Gradient Range -> Create Gradient Range
1.Select the insertion point by clicking in the drawing. The grid of the ETCS gradient range is displayed at the cross-hairs.
2.Determine the width. By dragging the mouse pointer to the right and then clicking in the drawing, the width of the ETCS gradient range is determined.
oThe ETCS Gradient range is stored on the layer PRS-ETCS GRADIENT RANGE.
oAny number of ETCS Gradient ranges can be inserted into the drawing.
8.With the function 'Transfer Gradient Range Graph' an ETCS Gradient range graph can be transferred to the ETCS Gradient range.
Command Line: PRS_NEIGUNGSGRAPH_UEBERTRAGEN
Ribbon: ProSig EPU -> Equipment ETCS -> ETCS Gradient Range -> Transfer Gradient Range Graph
1.Select the Gradient range to which the ETCS Gradient range graph will be transferred.
2.Select the Gradient graph from Step 3 which should be transferred to the ETCS Gradient range.
oThe ETCS Gradient range graph is visualized in the ETCS Gradient range. The designation of the ETCS Gradient range graph (E) is displayed to the left of the corresponding range after being transferred to the ETCS Gradient range.
oThe Assigning the ETCS Range displayed in the signalling layout plan is plotted thicker in the gradient range according to Ril 819.1344, see also ProSig System Objects - PSO Layer. In order to visualize in the drawing the actual line width used for the ETCS Range, set the AutoCAD system variable LWDISPLAY = ON.
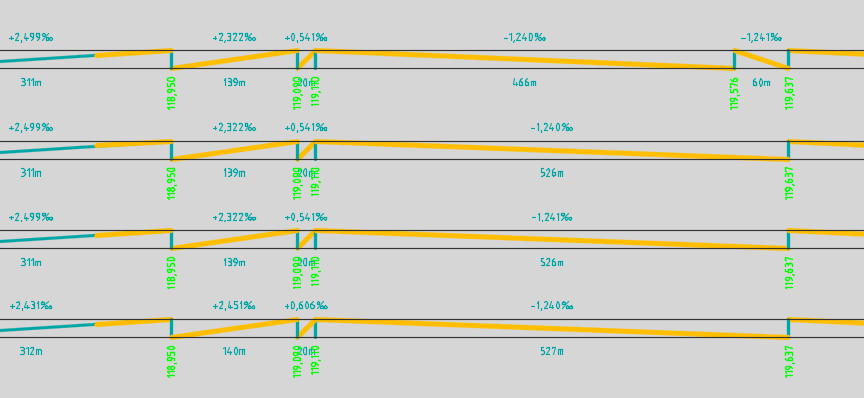
Illus.: Representation of the ETCS Gradient Range in the drawing
9.The ETCS Gradient range can be deleted with the AutoCAD function 'Erase'.